
 ReputatioLab, the crisis and reputation laboratory of Saper Vedere · Published on 13 February 2026 · Read the original article →


What to remember
-
Geographic proximity and closeness between metropolises, but an asymmetric divide
It is fairly easy to define the criteria that influence community proximity between actors, as the underlying logics seem stable:
- The first criterion that brings audiences together is geography: the closer one account is to another geographically, the more likely they are to form a network
- The second criterion concerns the metropolises: they will always be more connected to one another than to the peripheries. The latter look at the metropolises 3 times more than the reverse.
- The third criterion concerns the peripheries: they do not all look to every metropolis. Each looks to one and only one: the nearest. (This brings us back to the first criterion.) In that sense, they are connected.
-
A cultural divide: legitimate culture versus popular culture
The combined gap we found on the accounts of interest is quite simply staggering: a factor of 44x.
- Legitimate culture (ballet, cinema, fashion, gastronomy) is on average 7.7 times more present in metropolitan communities.
- Popular culture (football, fitness, YouTubers, shopping) is 5.7 times more present in peripheral communities.
It may also be explained by the number of institutions, media accounts and journalists who follow these communities more closely, but the trend is so strong that it is plain to see.
-
A political divide: peripheries on the right, metropolises on the left
Even if the analysis needs some tempering, since we chose towns with an established political history and affinities (Hénin-Beaumont being taken as a town), the peripheries follow the left-wing community 2 times less than the metropolises, while the metropolises follow the right 5 to 9 times less than the peripheries.
November 2018. Roundabouts occupied in areas that most Parisian commentators could not have found on a map. A revolt emerged from those “peripheral Frances” that Christophe Guilluy had been describing since 2010. The question had stopped being theoretical: it was there, in the street, in a high-vis vest.
Behind the expression “peripheral France” there is in fact an intellectual battlefield where geographers, economists, sociologists and demographers clash.
Each with their own data, methodology and, above all, reading grid. The debate is fascinating and involves sociologists, pollsters, geographers and economists.
And at Saper Vedere, we love it when we can use our instruments to help better understand societal theories and add our bit of tech. Cyril Dugenet and I are looking into it in an in-depth study!
The analysis
To carry out the analysis, we started by isolating the country's main metropolises and the peripheral towns that researchers on the subject talked about most.
We decided to look at Instagram because of its mainstream character. We judged that it was less politicised than X and that it covered most age groups in France. (And I do love getting off X from time to time.) We then isolated purely local accounts (see the methodological annexes) and obtained our audiences by city:
Distribution of Instagram accounts by city
The first, extremely striking thing is that our audiences across cities have almost nothing in common:
Two audiences that barely cross
On the other hand, regional geographic audiences and above all consistencies of audience between metropolises are already emerging:
Overlap matrix, 20 cities (%)
| Lyon | Bordeaux | Toulouse | Marseille | Strasbourg | Paris | Nice | Lille | Nantes | Rennes | Nevers | Lens | Châteauroux | Montluçon | Denain | Saint-Quentin | Vierzon | Alençon | Hénin-Beaumont | Florange | |
|---|---|---|---|---|---|---|---|---|---|---|---|---|---|---|---|---|---|---|---|---|
| Lyon | · | 0,37 % | 0,49 % | 0,76 % | 0,25 % | 0,57 % | 0,36 % | 0,32 % | 0,19 % | 0,36 % | 0,17 % | 0,05 % | 0,08 % | 0,12 % | 0,05 % | 0,05 % | ||||
| Bordeaux | 0,41 % | · | 0,95 % | 0,4 % | 0,12 % | 0,75 % | 0,16 % | 0,34 % | 0,31 % | 0,47 % | 0,13 % | 0,05 % | 0,09 % | 0,07 % | 0,65 % | 0,07 % | 0,06 % | 0,10 % | ||
| Toulouse | 0,55 % | 0,96 % | · | 0,58 % | 0,08 % | 0,62 % | 0,19 % | 0,14 % | 0,26 % | 0,50 % | 0,13 % | 0,05 % | 0,08 % | 0,10 % | 0,11 % | |||||
| Marseille | 0,98 % | 0,46 % | 0,66 % | · | 0,30 % | 0,84 % | 1,18 % | 0,40 % | 0,24 % | 0,30 % | 0,09 % | 0,06 % | 0,05 % | |||||||
| Strasbourg | 0,33 % | 0,14 % | 0,10 % | 0,30 % | · | 0,23 % | 0,21 % | 0,19 % | 0,05 % | 0,09 % | 0,07 % | |||||||||
| Paris | 0,78 % | 0,92 % | 0,76 % | 0,90 % | 0,24 % | · | 0,45 % | 0,34 % | 0,48 % | 0,84 % | 0,26 % | 0,09 % | 0,09 % | 0,09 % | 0,05 % | 0,19 % | 0,07 % | 0,17 % | 0,07 % | |
| Nice | 0,56 % | 0,22 % | 0,27 % | 1,44 % | 0,25 % | 0,52 % | · | 0,15 % | 0,17 % | 0,29 % | 0,14 % | 0,05 % | 0,10 % | 0,11 % | 0,05 % | 0,11 % | ||||
| Lille | 0,55 % | 0,52 % | 0,22 % | 0,54 % | 0,25 % | 0,42 % | 0,17 % | · | 0,14 % | 0,48 % | 0,14 % | 1,14 % | 0,05 % | 0,06 % | 1,97 % | 0,34 % | 0,16 % | 0,62 % | ||
| Nantes | 0,32 % | 0,48 % | 0,40 % | 0,33 % | 0,07 % | 0,60 % | 0,19 % | 0,14 % | · | 1,77 % | 0,12 % | 0,07 % | 0,06 % | 0,22 % | 0,21 % | |||||
| Rennes | 0,71 % | 0,82 % | 0,86 % | 0,45 % | 0,14 % | 1,19 % | 0,36 % | 0,54 % | 1,99 % | · | 0,76 % | 0,06 % | 0,07 % | 0,78 % | 1,79 % | |||||
| Nevers | 0,44 % | 0,32 % | 0,30 % | 0,19 % | 0,13 % | 0,50 % | 0,23 % | 0,21 % | 0,18 % | 1,02 % | · | 0,17 % | 0,45 % | 1,12 % | 0,06 % | 0,16 % | 0,33 % | 0,60 % | 0,05 % | |
| Lens | 0,15 % | 0,14 % | 0,12 % | 0,08 % | 0,07 % | 0,18 % | 0,08 % | 1,81 % | 0,05 % | 0,08 % | 0,18 % | · | 0,11 % | 0,17 % | 0,64 % | 0,87 % | 0,15 % | 0,15 % | 1,72 % | 0,10 % |
| Châteauroux | 0,29 % | 0,30 % | 0,25 % | 0,18 % | 0,10 % | 0,23 % | 0,24 % | 0,11 % | 0,14 % | 0,13 % | 0,61 % | 0,14 % | · | 0,46 % | 0,11 % | 0,14 % | 1,41 % | 0,11 % | 0,06 % | 0,05 % |
| Montluçon | 0,46 % | 0,26 % | 0,34 % | 0,15 % | 0,05 % | 0,26 % | 0,26 % | 0,14 % | 0,13 % | 1,51 % | 1,63 % | 0,23 % | 0,5 % | · | 0,07 % | 0,23 % | 0,33 % | 1,21 % | 0,07 % | 0,13 % |
| Denain | 0,16 % | 2,35 % | 0,13 % | 0,09 % | 0,10 % | 0,15 % | 0,09 % | 4,64 % | 0,07 % | 0,05 % | 0,10 % | 0,95 % | 0,13 % | 0,08 % | · | 0,94 % | 0,21 % | 0,13 % | 0,45 % | 0,05 % |
| Saint-Quentin | 0,25 % | 0,28 % | 0,16 % | 0,11 % | 0,06 % | 0,62 % | 0,15 % | 0,86 % | 0,08 % | 0,08 % | 0,27 % | 1,40 % | 0,17 % | 0,27 % | 1,01 % | · | 0,16 % | 0,29 % | 0,35 % | 0,17 % |
| Vierzon | 0,20 % | 0,26 % | 0,11 % | 0,10 % | 0,22 % | 0,08 % | 0,08 % | 0,57 % | 0,08 % | 0,56 % | 0,25 % | 1,75 % | 0,38 % | 0,23 % | 0,16 % | · | 0,17 % | 0,12 % | ||
| Alençon | 0,26 % | 0,41 % | 0,43 % | 0,10 % | 0,05 % | 0,56 % | 0,31 % | 0,43 % | 0,56 % | 4,10 % | 1,02 % | 0,25 % | 0,14 % | 1,43 % | 0,14 % | 0,29 % | 0,17 % | · | 0,10 % | 0,14 % |
| Hénin-Beaumont | 0,21 % | 0,11 % | 0,11 % | 0,07 % | 0,23 % | 0,14 % | 2,77 % | 0,06 % | 0,06 % | 0,17 % | 4,84 % | 0,14 % | 0,15 % | 0,86 % | 0,62 % | 0,07 % | 0,18 % | · | 0,18 % | |
| Florange | 0,42 % | 0,22 % | 0,15 % | 0,12 % | 0,40 % | 0,63 % | 0,15 % | 0,15 % | 0,25 % | 0,20 % | 0,48 % | 0,20 % | 0,42 % | 0,15 % | 0,50 % | 0,35 % | 0,40 % | 0,30 % | · |
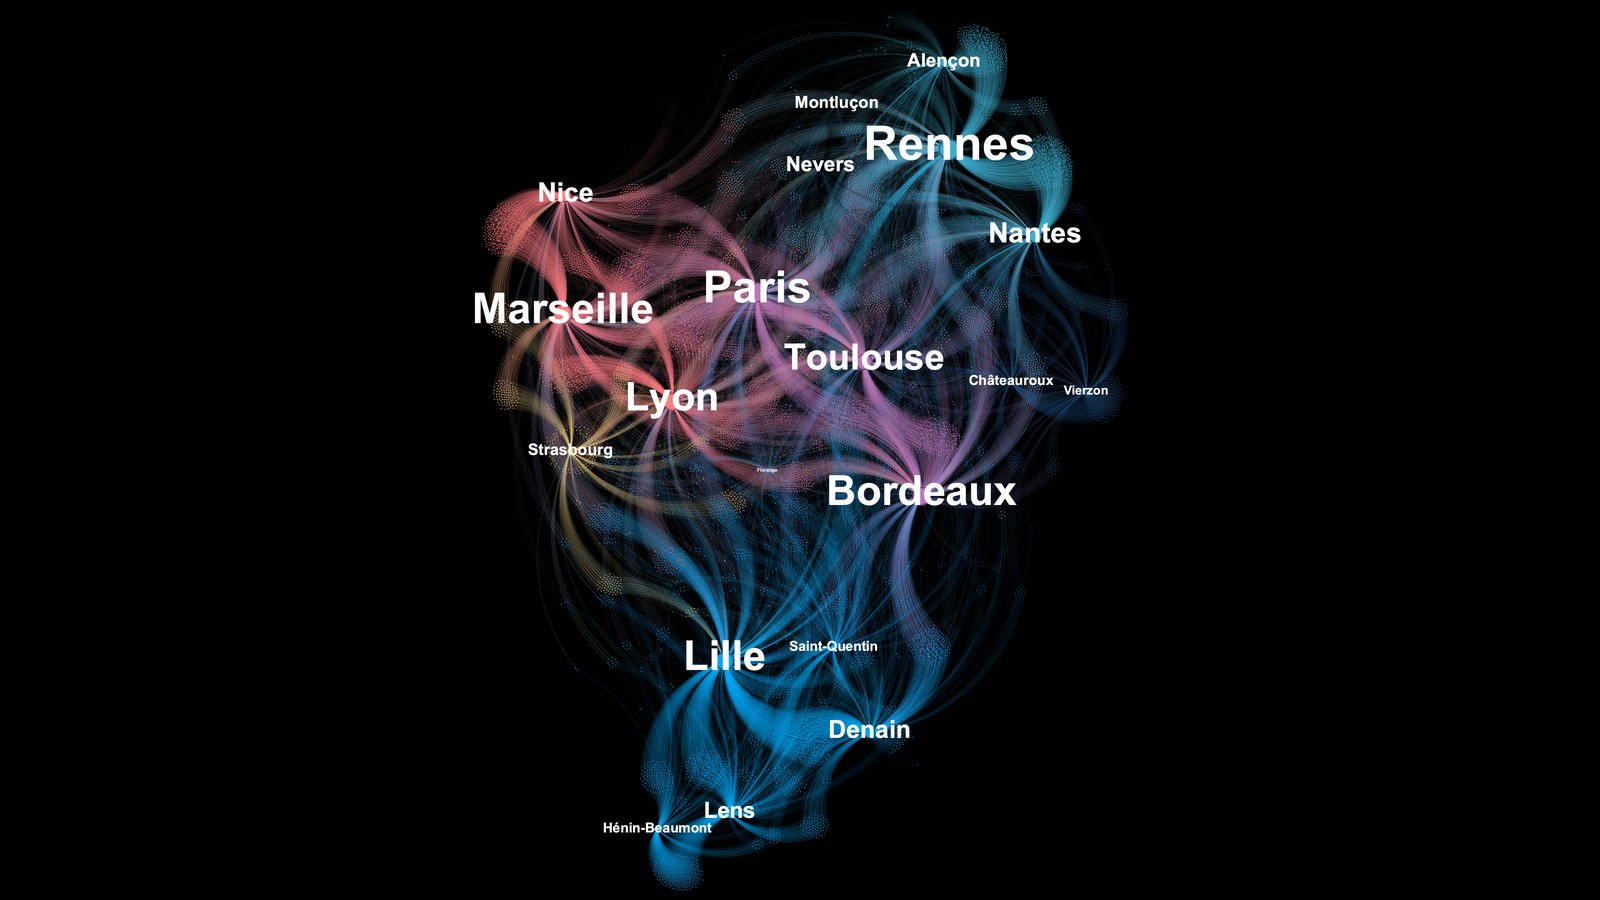
And for good reason: in the audiences we can see that geographically close accounts share similar audiences, which shows that they interact with one another. Likewise, metropolises are more connected to each other than to distant regions.
Next, it is interesting to look at who looks at whom:
Who looks at whom
Peripheries do not, in general, look to “the metropolises”. They look to ONE specific metropolis.
ReputatioLab, Metropolis vs peripheryPeripheries do not, in general, look to “the metropolises”. They look to ONE specific metropolis.
- Denain concentrates 59% of its metropolitan porosity on Lille.
- Alençon, 57% on Rennes.
- Lens, 64% on Lille.
- Hénin-Beaumont, 73% on Lille.
Which metropolis each periphery looks to
It is a gravitational model in the strict sense: each periphery orbits around a single centre. The nearest metropolis captures almost all of the available flow of attention.
And the metropolis itself? Paris directs 83% of its external connections to other metropolises. (Marseille, 93%. Lyon, 84%. Toulouse, 86%)
Share of a metropolis's external connections going to other metropolises
The one notable exception is Lille (only 42%). It is surrounded by its former mining basin (Denain, Lens, HB, Saint-Quentin), but it does not look to the periphery either. If you want to look at everything in depth:
The interactive audience map
The map is still served by ReputatioLab: its data exceeds what our hosting accepts for a single file. Each point is an account, each link a shared follow.
What else do they follow?
Next, we wanted to analyse the other accounts they followed, beyond our accounts from metropolises. The problem: we cannot analyse the 400k+ audience members. So we took a sample of 25,000 accounts (see our methodology) in 6 cities: 3 metropolises (Paris, Lyon, Marseille) and 3 peripheral cities (Hénin-Beaumont, Florange, Nevers).
All of this gave us all of their interests, within which we could each time distinguish the accounts followed by metropolitan followers and by peripheral followers, in a navigable map (you can search for those followed by at least 100 people):
Then, with this ecosystem in hand, we played with the communities to see whether the starting peripheral and metropolitan accounts have different habits. And what we are about to discover is chilling: (you can see the sub-communities by clicking on the communities)
Communities of interest
Culture & Fashion13,335 accounts · metropolis 26.7% · periphery 5.7%
Entertainment12,760 accounts · metropolis 5.0% · periphery 24.1%
Marseille & Gastronomy11,734 accounts · metropolis 25.7% · periphery 5.8%
Nevers, Burgundy, TV & Val-de-Loire10,181 accounts · metropolis 1.5% · periphery 45.6%
Lifestyle & Consumption7,232 accounts · metropolis 5.8% · periphery 16.3%
Lyon3,088 accounts · metropolis 35.8% · periphery 13.4%
Grand-Est2,577 accounts · metropolis 2.4% · periphery 46.6%
Lille region & right2,569 accounts · metropolis 8.0% · periphery 38.2%
 Rassemblement national604 accounts · 15 in metropolises · 119 in peripheries
 Reconquête282 accounts · 17 in metropolises · 78 in peripheries
Other communitiesthree communities with no sub-community
 V and B921 accounts · 84 in metropolises · 358 in peripheries
 Fitness Park246 accounts · 4 in metropolises · 83 in peripheries
- On one side, the metropolis consumes ballet, opera and theatre (35.9% M vs 4.4% P), cinema (31.3% M vs 3.1% P), fashion (19.8% M vs 2.2% P) and gastronomy (26.3% M vs 3.0% P).
- On the other hand, the periphery consumes football (28.6% P vs 7.1% M), fitness (31.7% vs 3.7%), YouTubers and TikTokers (24.5% vs 1.6%), and popular stand-up (24.9% vs 0.9%)
Legitimate culture versus popular culture
Where the metropolis consumes high-end media, the periphery follows YouTubers, TikTokers, local tips and deals, local independent businesses, and so on. The finding is striking and quite simply incredible.
And that is not all. Politically too, it is striking:
- Peripheries follow left-leaning media 2 times less (8.6% vs 19.9%)
- Metropolises follow the right and the far right 5 to 9 times less (2.5% vs 19.7% for the RN, 9.6% vs 34.5% for the political right)
The political divide
Rassemblement national604 accountsThe asymmetry is striking: the left-leaning media are “slightly” less followed in the periphery, whereas the right is massively absent from metropolitan radars.
ReputatioLab, Metropolis vs peripheryThe asymmetry is striking: the left-leaning media are “slightly” less followed in the periphery, whereas the right is massively absent from metropolitan radars.
In short, this study has allowed us to confirm quite a few theories. A chance to go back over the literature:
Summary of the concepts used
Guilluy, an essayist and geographer, puts forward a simple and striking thesis: there are two Frances.
- On one side, the France of the metropolises, which concentrate skilled employment, high incomes and economic opportunities.
- On the other, peripheral France - small and medium-sized towns, rural areas, territories far from the major employment hubs - where working-class people on a downward path are concentrated.
In his view, globalisation and metropolisation have created a system in which the metropolises capture wealth while the rest of the country is “sacrificed”. Working-class people in the peripheries are not just poor: they are invisible. Neglected by the media, ignored by the political class, and despised by the cultural elites of city centres.
He does so without data or fieldwork. He is soon severely attacked. The main criticism: the metropolis/periphery dichotomy is said to be a false opposition.
For his part, Laurent Davezies, a territorial economist, publishes a new typology:
- Productive and dynamic France: the employment hubs of the large metropolises - Île-de-France, the urban cores of Lyon, Toulouse, Bordeaux and Nantes. A concentration of driving sectors: high technology, high-end services, finance. Net job creation, low unemployment.
- Non-productive but dynamic France: these territories do not produce much, but they capture wealth produced elsewhere. Attractive coastlines (Côte d’Azur, the Atlantic seaboard), tourist mountain areas, cantons that attract retirees and commuters. All of this creates a residential economy.
- Productive but fragile France: the former industrial basins of the North, which keep a productive orientation but whose capacity is eroding. High unemployment, a declining economy.
- Dependent France: territories whose main resource is social income - family allowances, the RSA, pensions. Almost no economic dynamism.
For him, the key is that redistribution is shrinking.
Lévy adds further nuance with the “urbanity gradient”, according to density (spatial concentration of inhabitants and activities) and diversity (variety of urban functions, population types, opportunities). The denser and more diverse a place, the more “urban” it is.
Where this becomes highly relevant to us is that this gradient predicts electoral behaviour better than the simple opposition between rural and urban areas.
- The city centres of large conurbations vote more for openness (pro-Europe, pro-immigration, pro-diversity)
- Peri-urban areas and small centres, conversely, lean towards “closure”.
Another concept that interests us politically: Charmes introduces the concept of clubbisation. The idea is that traditional neighbourhood relations, founded on the political community, are turning into contractual, selective, fee-based relations. The municipality is no longer a space of citizenship but a service provider.
Charmes identifies three forms of fragmentation in peri-urban areas:
- Political (a multiplicity of territorial authorities, incoherent urban planning)
- Landscape (inorganic sprawl, absence of urban identity)
- Social (growing separation of social groups, depoliticisation of urban relations).
The result: a “crumbled city”, vulnerable to energy and environmental shocks, and systematically dependent on the car.
In any case, there are some overall points of consensus:
- Territorial inequalities have been real and growing in France since 2008.
- Economic concentration in the major metropolises is real: more than 70% of senior-category jobs are in metropolises, with incomes 15 to 25% above the national average.
- The feeling of marginalisation in peripheral areas is well documented.
- The redistribution crisis threatens the old mechanisms of territorial equalisation.
And the clear disagreements:
- Opposition between binary views (metropolises versus peripheries) and multidimensional ones.
- Opposition between geographic determinism and complexity
- Economic or cultural variables
In the end, everyone is a little bit right, and our small study has not settled the disagreements. These are complex fields where politics and ideology play an important role.
Methodology
The accounts analysed:
The Instagram accounts selected, city by city
 Instagram
 bfmlyon
1. Context and objectives of the study
- First phase: selection of the cities above.
- Second phase: extraction of followers on Instagram (chosen because it is mainstream compared with X). This gives the Venn diagram analyses, the analyses of shared accounts, and so on.
- Third phase: selection of a representative sample to map the relationships between actors
2. Cities selected for the relationship maps of the communities
Following the cities analysed above, we selected six:
- Metropolitan cities: Paris, Lyon, Marseille
- Peripheral cities: Hénin-Beaumont, Florange, Nevers
We were faced with a structural imbalance between the two categories (66,117 metropolis vs 14,396 periphery), so a stratified sampling strategy was adopted:
- Full inclusion of the minority category: All 14,396 “periphery only” labels were included in the sample.
- Random sampling of the majority category: 10,604 labels were randomly selected from the 66,117 “metropolis only” labels.
- Reproducibility: A fixed random seed (seed = 42) was used to guarantee the reproducibility of the sampling.
| Indicator | Value |
|---|---|
| Total number of labels | 25 000 |
| Public accounts (is_private = False) | 100% |
Distribution by category
| Category | Count | Proportion |
|---|---|---|
| Metropolis only | 10 604 | 42,4% |
| Periphery only | 14 396 | 57,6% |
| Total | 25 000 | 100% |
Geographic distribution
| City | Category | Count |
|---|---|---|
| Nevers | Periphery | 8 915 |
| Lyon | Metropolis | 4 418 |
| Hénin-Beaumont | Periphery | 3 416 |
| Marseille | Metropolis | 3 165 |
| Paris | Metropolis | 3 107 |
| Florange | Periphery | 2 079 |
Limitations and methodological considerations
- Under-representation of metropolitan cities: Only 16% of the available metropolitan accounts were included (10,604 out of 66,117), against 100% of peripheral accounts. This asymmetry is inherent in the imbalance of the source data.
- Potential selection bias: Private accounts (229,879 in the source file) could not be analysed, which may introduce a bias if the private/public status is correlated with other variables of interest.
- Geographic granularity: The “city” variable can contain several cities (in the format “City1 // City2”), which reflects the multiple follows of a single account. Membership of a category was determined by the presence of at least one target city.